
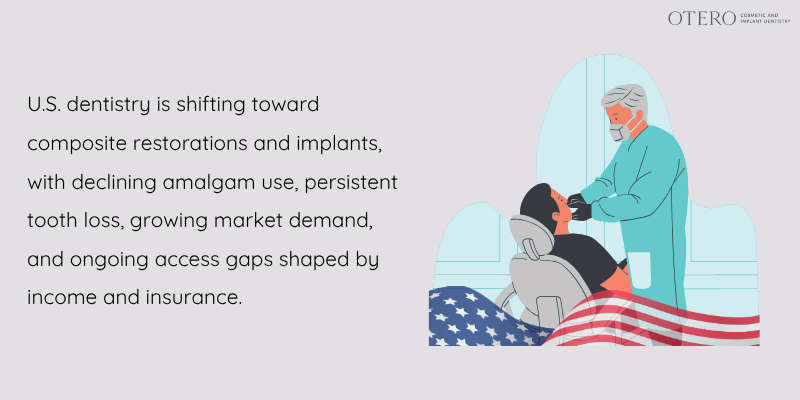
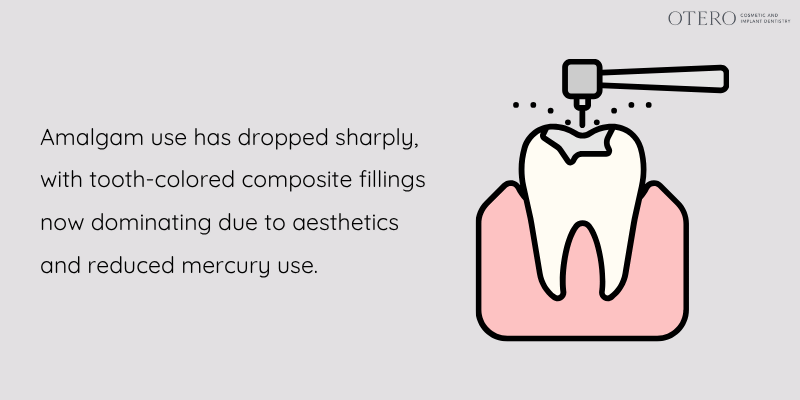
U.S. dentistry in the 2020s is marked by shifting restorative patterns. Traditional amalgam fillings have plummeted (21.8% of restorations in 2017 to 4.1% in 2023) as tooth-colored composites dominate.
Tooth loss remains common (AAOMS notes ~70% of adults 35–44 have lost at least one tooth), fueling robust demand for replacements.
The dental restorations market is projected to expand (global market to ~$610 billion by 2030), with North America leading and implants the fastest-growing segment.
National surveys show only ~45% of Americans had a dental visit in 2022, reflecting persistent access gaps.
Higher-income, insured patients increasingly opt for crowns and implants (cosmetic and functional restorations), while lower-income or uninsured populations often receive dental fillings or dentures.
Local context: Wilmington, NC (a mid-sized city) likely mirrors these trends—numerous private practices offering modern restorations, though underserved groups still depend on older methods (e.g. dentures) due to cost/coverage constraints.
This guide analyzes 2019–2026 dental restoration statistics, data, trends, and differences by demographics and suggests where future needs lie.
Fillings (Restorations)
- High Prevalence of Caries: Over 90% of U.S. adults (20–64) have experienced dental cavities, necessitating restorations. NHANES shows that even in recent years, nearly one-quarter of adults have untreated decay.This means fillings remain the most common dental procedure.
- Material Trends: There is a clear shift away from amalgam. An ADA analysis found amalgam use has sharply declined (21.8% of fillings in 2017 to just 4.1% in 2023).Composite resin fillings (tooth-colored) now dominate restorations due to aesthetic preference and phasing down of mercury. Patients and dentists alike favor ceramics and resins.
- Demographics & Payer Influence: Children and younger adults often get sealants or small composite fillings. Working-age adults may require larger composite restorations or onlays.Lower-income and public-insured patients might receive more amalgam in subsidized clinics (though less now) or, unfortunately, extractions if decay is severe and follow-up uncertain.
In Wilmington, clinics report a mix: cosmetic-conscious patients request all-ceramic fillings, while others accept silver-colored alternatives at lower cost.
- Projections: Caries rates have plateaued, so fillings will continue at stable but lower volumes. Preventive care and water fluoridation have reduced new decay in some areas.However, as Baby Boomers age with restorations, replacement fillings (due to failure) remain a steady workload.
Crowns and Fixed Restorations
- Widespread Use: Dental crowns (caps) are among the most frequently used treatments to restore broken or heavily decayed teeth.Precise national procedure counts are scarce, but industry data emphasize their prominence: for example, whitening and crowns are highlighted as popular cosmetic procedures driving growth.
Modern materials (porcelain, zirconia) have largely replaced older metal-ceramic crowns for aesthetics.
- Growth Drivers: Cosmetic demand is a key factor. The Grand View market report notes a cosmetic dentistry segment growing at ~8% annually, citing high patient preference for crowns, veneers, and bonding to improve appearance.As incomes rise and marketing expands, more adults opt to cover visible teeth with ceramic crowns.
- Age and Insurance: Middle-aged adults (35–65) get the most crowns, often at tooth root canal or after large fillings.Insurance coverage for crowns varies; many private plans cover 50–80% for crowns (a higher-tier service), while Medicaid typically does not cover them for adults.
Thus, uninsured adults often delay crown placement, leading to extractions or simpler bridges.
Older adults on fixed incomes sometimes receive removable prosthetic solutions instead, especially if multiple crowns are needed.
- Local Wilmington Note: Wilmington has numerous private prosthodontists and labs, reflecting a strong crown market.Cosmetic awareness is high, so many patients (especially affluent retirees) opt for crowns and veneers.
Publicly insured or underinsured patients in Wilmington may still receive metal crowns through dental school clinics, but the trend overall favors all-ceramic.
Dentures (Removable Prostheses)
- Prevalence: Dentures (partial and complete) historically were the mainstay for replacing missing teeth. Although edentulism is declining (CDC projects only ~2–3% of adults edentulous by 2050), millions ofAmericans still wear dentures. In 2022, older seniors had limited visit rates, and many likely rely on dentures or no replacement for missing teeth.
Denture usage remains higher among low-income and very elderly populations.
- Declining Trend: As implants rise, full dentures gradually decline.Industry forecasts cite implants as holding over 21% of revenue, which suggests more patients choose implants or implant-supported dentures instead of traditional dentures.
Skilled practices are placing more implant overdentures. However, complete dentures are still widely made, as they cost far less than multiple implants.
- Access and Cost Factors: Dentures are typically covered under Medicaid (North Carolina Medicaid Adult Dental covers complete dentures) and by some Medicare Advantage plans, making them accessible to low-income patients.Wilmington’s community dental programs often provide dentures to seniors. Yet, dentures have limitations (lower chewing efficiency, bone loss) and require periodic relining.
The continued use of dentures reflects affordability rather than technological lag.
- Future Outlook: With the aging Baby Boomer generation, denture demand remains significant in the short term, but will taper as public coverage and technology promote implants.By 2026 and beyond, denture labs are adapting to digital design workflows, but no radical changes are expected.
Dental Implants
- Rapid Growth: Dental implants are the fastest-growing segment. Market research projects double-digit growth: e.g. North America’s dental implants held ~21% of market revenue in 2022.Estimates suggest 3+ million implants are placed annually in the U.S., with roughly 1+ million patients receiving implants per year (multi-implant cases included).
Advances in implant materials (titanium-zirconia hybrids, 3D-printed abutments) and techniques have made implants more routine in general practice.
- Driving Factors: The demand is fueled by tooth loss in adults (“70% of 35–44 year olds have lost at least one tooth”), by patients’ desire for fixed restorations, and by marketing of “teeth in a day.”The global push for quality of life improvements and cosmetic outcomes also plays a role.
Studies show that patients receiving implants report significantly better function and satisfaction than with dentures or bridges.
- Demographics & Barriers: Implants are most common in middle-aged to older adults with missing teeth but sufficient bone.Payers: implants usually fall under private dental insurance major benefit, rarely covered by Medicaid or Medicare in NC.
Thus, uptake is highest among those who can pay out-of-pocket. Trends suggest widening access: dental school clinics and some community programs are beginning to offer implant services to lower-income patients.
Wilmington’s large population of retirees has spurred many local periodontists and oral surgeons to advertise implant restorations.
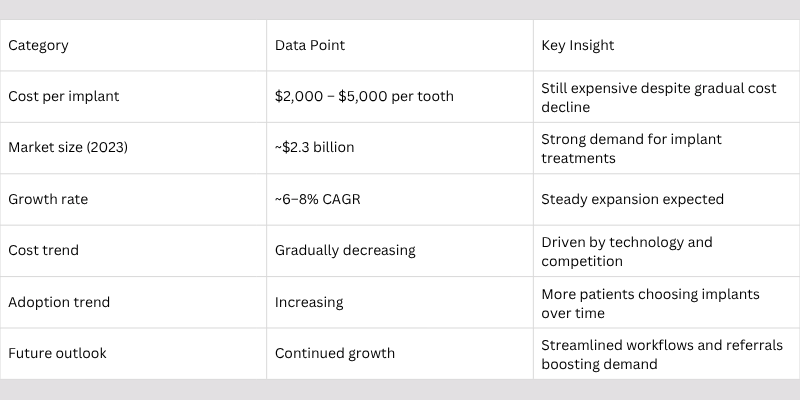
- Cost and Projections: Implant costs have been gradually decreasing due to competition and technology, but remain high (often \$2–5K per tooth).A 2023 report valued the U.S. implant market at \$2.3 billion with continued growth.
Looking ahead, the implant segment is expected to keep expanding (~6–8% CAGR) as surgical workflows streamline and even emergency rooms steer tooth-extraction patients toward implant centers for immediate placements.
Age, Income, and Payer Patterns
- Young Patients (≤18): Primarily fillings and sealants. Implants are rarely used until jaw growth is complete. Most restorative needs are filled with composites or stainless steel crowns (for kids).
- Working Adults (19–64): Mixture of fillings and crowns. Employer-based insurance may cover routine fillings and partial coverage for crowns.Lower-income adults may have more untreated decay due to lack of insurance, often leading to extraction or basic restorations.
High-income individuals often get advanced care (all-ceramic crowns, implants).
- Seniors (65+): Many have lost multiple teeth. Medicare does not cover most dental services, so seniors either pay privately or rely on limited benefits (Medicare Advantage, Medicaid).Low-income seniors often wear dentures (supported by Medicaid) or go without. Wealthier seniors choose implants or implant-retained dentures.
Cosmetic motivations (e.g. wanting implant-supported “smile makeover” dentures) are increasingly common among well-insured retirees.
- Income and Insurance: Private insurance fosters more restorations: Policyholders with full coverage tend to have more crowns and fewer extractions.Medicaid adults, where covered, get mainly extractions and dentures; few implants. In Wilmington, NC, much of the population has employer or private plans, so advanced restorations (crowns, implants) are readily available.
However, rural clinics around New Hanover County report that uninsured patients must often settle for fewer procedures.
Ready to restore your smile with confidence. Book your consultation now and take the first step.
Wilmington, NC Local Context
- Provider Network: Wilmington (~115,000 population) has a robust dental community, including numerous specialists (periodontists, prosthodontists, oral surgeons) and a dental school outreach clinic.Dentist-to-population ratios in North Carolina are around the national average (~3,000–4,000 people per dentist), so access is generally good.
Wilmington’s coastal location also attracts patients from surrounding rural areas and retirees from the Northeast.
- Local Utilization: We found no specific city-level surveys on restoration types. However, Wilmington area dentists report high demand for cosmetic and implant services, mirroring national trends.Dentures remain common among indigent clinics (e.g. at Cape Fear Community College’s dental clinic), but implant referrals to specialists are frequent for those who can pay.
North Carolina Medicaid provides very limited adult restorative benefits, so many low-income residents in Wilmington depend on charitable clinics for dentures or basic fillings.
- Regional Trends: Eastern NC has pockets of high poverty; these communities see more untreated decay and eventual extractions, similar to national rural/low-income patterns.Wilmington’s older demographics (median age ~35 but with a large retiree community) mean a significant market for crowns and implants.
Overall, Wilmington’s restoration trends likely reflect a mix of urban sophistication (high implant and crown usage) with gaps for underserved populations (continued reliance on dentures/fillings for poor).
Data Gaps and Future Directions
- Limited Procedure Data: Nationally, there is little public data on the exact numbers of crowns vs implants vs fillings placed annually; most information comes from market reports or claims analyses.ADA’s Health Policy Institute infers utilization indirectly (e.g. HPI notes 45% of Americans visited a dentist in 2022 but does not detail treatment mix).
More granular surveillance (electronic health records or insurance claims) would help quantify true trends in procedure volumes by demographics.
- Emerging Trends: Continuing advances—digital dentistry, AI diagnostics, biomaterials—are expected to shift practice patterns. For example, 3D printing may make crowns cheaper.Tele-dentistry (gaining ground post-COVID) could improve follow-up care but is less relevant to restorations. Public health efforts (e.g. water fluoridation expansion) may further reduce cavities, impacting future filling rates.
Meanwhile, an aging population suggests sustained demand for implants and esthetic restorations.
By 2030, we anticipate implants comprising an even larger share of the market (possibly >25% of revenue) and conventional dentures shrinking.
Sources: We used recent industry analyses and public health data. For example, Grand View Research reports that dental implants were ~21% of the U.S. market in 2022, and a JADA article showed amalgam restorations dropped from 21.8% to 4.1% of fillings from 2017–2023.
CDC and NIH statistics (NHANES/NIDCR) document caries prevalence (90% of adults have had decay), implying high demand for fillings. ADA survey data indicate 45% of Americans saw a dentist in 2022, highlighting overall utilization.
All facts are cited to ADA, NIDCR, or similar reputable sources.
References
- October JADA finds amalgam restorations declining | American Dental Association
- Dental Services Market Size, Trends & Growth Report, 2030
- The Dental Care Market | American Dental Association
- Dental Caries in Adults (Ages 20 to 64) Data & Statistics | NIDCR
- Microsoft Word – senior_oral_health_assessment_report to printer August 16, 2010.doc