
Scope and evidence base
For research purposes, the strongest U.S. evidence base is not evenly distributed across the three topics.
Tooth loss is measured best through examination-based NHANES tables, now summarised by CDC and NIDCR from the latest public oral-exam cycle, 2017–March 2020.
By contrast, recent federal reporting on denture use and implant uptake is thinner and relies more on peer-reviewed secondary analyses of NHANES, utilisation data, and consumer-survey estimates.
NHIS adds newer access-to-care data, but it does not measure edentulism in its 2022 older-adult report.
That means a proper research guide should treat the subjects differently: use NHANES/NIDCR/CDC tables for age-specific tooth loss, use a mix of NHANES analyses and consumer-survey estimates for dentures, and use NHANES-based peer-reviewed national studies for implant adoption.
For Wilmington and New Hanover County, the public record is much stronger on service access and county programmes than on directly measured local implant prevalence.
National age patterns in tooth loss
The age gradient in tooth loss is clear and steep. In the latest national examination cycle, adults aged 20–34 retained a mean of 27.0 permanent teeth, compared with 25.6 at ages 35–49, 23.3 at ages 50–64, 21.7 at ages 65–74, and 19.8 at ages 75 or older.
Complete tooth loss followed the same pattern: it was too rare to report reliably at ages 20–34, then rose to 1.2% at ages 35–49, 5.9% at ages 50–64, 11.4% at ages 65–74, and 19.7% at ages 75 or older.
| Age group | Mean permanent teeth remaining | Complete tooth loss |
| 20–34 | 27.0 | Not reliably reportable |
| 35–49 | 25.6 | 1.2% |
| 50–64 | 23.3 | 5.9% |
| 65–74 | 21.7 | 11.4% |
| 75+ | 19.8 | 19.7% |
All age-group values in the table above come from NIDCR/CDC summaries of NHANES 2017–March 2020.
The trend line is favourable, but not uniform. Among adults aged 50–64, complete tooth loss fell from 10.3% in 1999–2004 to 5.9% in 2017–March 2020.
Among seniors overall, it fell from 27.2% to 15.2% over the same span; among those aged 65–74 it dropped from 24.0% to 11.4%, and among those aged 75+ from 31.2% to 19.7%.
In other words, tooth retention has improved, but late-middle-age and older-adult cohorts still carry the bulk of severe tooth-loss burden.
The burden is also socially patterned. In 2017–March 2020, adults aged 20–64 in high poverty had a 6.8% edentulism rate versus 0.9% in low poverty, and current smokers had a 7.6% rate versus 0.3% among never-smokers.
Among adults 65+, the gradients were even sharper: 29.8% among seniors in high poverty, 33.4% among those with less than high-school education, and 29.4% among current smokers.
These disparities matter because they shape both who needs dentures and who can realistically access implants.
What the current evidence says about denture use
Recent national denture surveillance is weaker than tooth-loss surveillance, so the best current picture comes from NHANES-based studies plus consumer-survey estimates.
In a NHANES 2009–2018 analysis of adults aged 30–59, 3.5% of participants used dentures; denture users had a mean age of 50.1 years, and 55.8% of denture users were aged 50–59.
That shows denture use is not confined to the elderly, but it is heavily concentrated at the older end of working age.
Among edentulous adults, dentures remain the dominant replacement modality. In a NHANES-linked mortality study of 1,649 edentulous American adults, 1,204 were complete-denture wearers and 445 were non-denture wearers.
That does not give a clean national prevalence estimate, but it does show that even within a fully edentulous population, most people in the analytic sample had conventional dentures rather than no prosthetic replacement.
At the consumer-market level, the Academy of General Dentistry cited U.S. Census and Simmons National Consumer Survey data showing that 40.99 million Americans reported using dentures in 2020.
That figure is broader and methodologically different from NHANES prevalence estimates, so it should be treated as a market-facing user count rather than a clinical prevalence rate.
Still, it is useful for scale: dentures remain a large category in U.S. tooth replacement even as total edentulism falls.
Taken together, the best interpretation is this: complete-denture dependence is gradually shrinking as a share of the population because edentulism is falling, but dentures still play a major role because severe tooth loss remains concentrated after age 50 and especially after age 75, and because many fully or partially edentulous adults do not move into implant-based care.
Implant adoption is rising, but unevenly
Implant adoption has grown markedly in the U.S., especially in older adults.
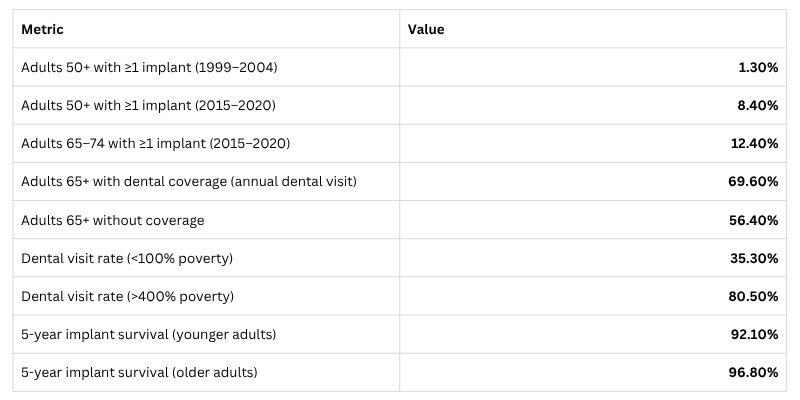
A 2024 JADA analysis of NHANES found that the prevalence of having at least one dental implant among adults aged 50+ rose from 1.3% in 1999–2004 to 8.4% in 2015–2020.
During 2015–2020, adults aged 65–74 had the highest prevalence reported in the abstract, at 12.42%.
The same study found lower implant prevalence among non-Hispanic Black adults, people experiencing poverty, and adults with less than a college education.
That pattern is consistent with the earlier, highly cited national trend paper by Elani and colleagues.
Using NHANES 1999–2016, they found dental implant prevalence among U.S. adults with missing teeth rose from 0.7% to 5.7% by 2015–2016.
The largest absolute increase was among adults aged 65–74, while the largest relative increase was among adults aged 55–64.
Their scenario-based projections to 2026 ranged widely, from 5.7% in a conservative case to 23% in a high-growth case, which is best read as a range of plausible uptake paths rather than a single forecast.
The access story matters as much as the age story. In 2022, among U.S. adults aged 65+, those with dental coverage were more likely to have had a dental visit in the prior year than those without coverage, 69.6% versus 56.4%.
Dental-visit rates also ranged from 35.3% among those below 100% of the federal poverty level to 80.5% among those above 400% of poverty.
Since implants are among the costliest restorative options, these care-access gradients strongly suggest that implant adoption is constrained more by income, coverage, and care access than by age alone.
Age itself is not a clear biological barrier to implants. A 2025 study summary reported estimated 5-year implant survival of 92.1% in a younger group and 96.8% in an older group, supporting the broader point that older age does not automatically make implant treatment unviable.
For research, this is important: observed lower uptake among older or poorer groups should not be read purely as a clinical suitability issue.
Wilmington and North Carolina context
For a Wilmington lens, the most recent public benchmark is easier to establish at the North Carolina level than at city level.
Using 2024 BRFSS-based comparisons, America’s Health Rankings reported that 17.0% of North Carolinians aged 65+ had had all teeth removed due to decay or gum disease, compared with a U.S. value of 11.4%.
The same source reported that 66.1% of North Carolina adults had visited a dentist or dental clinic within the past year in 2024.
That suggests North Carolina, as a state context for Wilmington, still carries a heavier senior tooth-loss burden than the national benchmark despite reasonably solid recent dental visits.
At the local service level, New Hanover County has made older-adult dental access a visible programme priority.
The county’s Older Adult Dental Programme began in July 2022 for low-income adults aged 55+, and county materials show eligibility tied to New Hanover residency and income below 300% of poverty.
Public county notices say the programme provides exams, X-rays, cleanings, fillings, extractions, root canals, dentures, and related care.
These materials are notable because they focus squarely on the high-risk age group for severe tooth loss and on conventional restorative needs rather than implants.
The county also reports non-trivial outreach volume. A New Hanover County progress document states that the county’s dental outreach programmes collectively saw more than 2,500 patients in 2023.
While that figure combines outreach activity rather than isolating implants, it shows that oral-health access is active enough locally to register as a community-health delivery issue, not just a private-practice market issue.
For Wilmington-specific research, the practical implication is that local public evidence is strongest on need, access, and denture-oriented services.
Implant adoption in Wilmington almost certainly exists through the private restorative market, but public county and city sources are not currently giving the same kind of local implant-prevalence tables that CDC/NIDCR provide nationally for tooth loss.
Outlook beyond 2026
The long-run tooth-loss outlook is downward in prevalence but not necessarily trivial in absolute need.
A widely cited U.S. projection estimated that edentulism prevalence would continue falling to 2.6% by 2050, with about 8.6 million edentulous Americans, around 30% lower than in 2010.
So the country should continue moving away from complete tooth loss, but it will not eliminate it.
At the same time, the population at greatest risk is growing. U.S. demographic projections indicate that the number of Americans aged 65+ will rise from 58 million in 2022 to 82 million by 2050, and by 2030 roughly one in five Americans will be 65 or older.
That means the denominator is shifting: even with lower age-specific tooth-loss rates, the absolute number of older adults needing maintenance, partial prostheses, overdentures, and implants can remain large.
For implants, the direction of travel is still upward.
Elani’s 2026 scenarios showed wide upside potential, and the newer 2024 NHANES-based JADA study confirms that adoption continued climbing through 2015–2020, with the strongest prevalence among ages 65–74.
The most defensible research conclusion beyond 2026 is therefore not a single-point forecast, but a structured expectation: implant prevalence should continue to rise, especially in the younger-old population, unless affordability, coverage, and workforce constraints flatten uptake.
For dentures, the likely future is compositional change rather than disappearance.
Complete dentures should decline as edentulism falls, but removable partial dentures and implant-supported overdentures should remain relevant because many Americans will age with some natural teeth rather than none.
In research terms, the post-2026 market is less about “dentures versus no dentures” and more about how replacement shifts across complete dentures, partial dentures, overdentures, and implants as the U.S. population ages with better tooth retention.
Research takeaways

The central U.S. pattern is straightforward: tooth loss still rises sharply with age, but complete edentulism is declining across successive cohorts.
Denture use remains substantial in absolute terms, yet the strongest growth story is implants, particularly among adults entering older age with more retained teeth.
The main divide is not simply chronological age; it is the interaction of age with poverty, education, smoking, coverage, and care access.
For Wilmington and New Hanover County, the public evidence currently points most clearly to an older-adult access problem being addressed through county dental programmes, while true local implant adoption remains a data gap best filled by claims data, provider surveys, or local practice-level market research layered on top of national NHANES evidence.
References
https://www.nidcr.nih.gov/research/data-statistics/tooth-loss
https://www.nidcr.nih.gov/research/data-statistics/tooth-loss
https://www.nidcr.nih.gov/research/data-statistics/tooth-loss/adults
https://www.nidcr.nih.gov/research/data-statistics/tooth-loss/adults
https://www.frontiersin.org/journals/cardiovascular-medicine/articles/10.3389/fcvm.2022.1000478/full
https://www.frontiersin.org/journals/cardiovascular-medicine/articles/10.3389/fcvm.2022.1000478/full
https://www.sciencedirect.com/science/article/abs/pii/S0300571220301020
https://www.sciencedirect.com/science/article/abs/pii/S0300571220301020
https://www.agd.org/constituent/news/2022/09/12/the-latest-in-dentures
https://www.agd.org/constituent/news/2022/09/12/the-latest-in-dentures
https://www.sciencedirect.com/science/article/abs/pii/S0002817724001867
https://www.sciencedirect.com/science/article/abs/pii/S0002817724001867
https://pubmed.ncbi.nlm.nih.gov/30075090
https://pubmed.ncbi.nlm.nih.gov/30075090
https://www.cdc.gov/nchs/products/databriefs/db500.htm
https://www.cdc.gov/nchs/products/databriefs/db500.htm
https://pmc.ncbi.nlm.nih.gov/articles/PMC12423580
https://pmc.ncbi.nlm.nih.gov/articles/PMC12423580
https://www.americashealthrankings.org/explore/measures/teeth_extractions_sr/NC
https://www.americashealthrankings.org/explore/measures/teeth_extractions_sr/NC
https://www.nhcgov.com/1235/Dental-Health
https://www.nhcgov.com/1235/Dental-Health
https://news.nhcgov.com/DocumentCenter/View/10900
https://news.nhcgov.com/DocumentCenter/View/10900
https://www.nhcgov.com/CivicAlerts.asp?AID=126&ARC=407
https://www.nhcgov.com/CivicAlerts.asp?AID=126&ARC=407